
A HiMCM problem has no answer key. Nobody will tell your team whether the number you produced is right, because for an open-ended real-world problem there is no single right number. That leaves exactly one source of evidence that your model is any good: the testing you run on it yourself, and the honesty with which you report what that testing found.
Why the missing answer key changes the whole exercise
Students arriving from AMC, AIME or a Chinese-curriculum maths class have spent years in a system where correctness is external. You solve, you check against the key, you know. HiMCM removes that entirely. COMAP describes the contest as teams applying mathematics to model and develop a solution to a real-world problem across a 14-day window — 4–17 November 2026 for this edition — and describes what teams submit as “a complete technical report explaining their approach, assumptions, analysis, and conclusions.”
Read that list again: approach, assumptions, analysis, conclusions. Three of those four are about reasoning, not about a result. This is the same point that makes HiMCM a modelling contest rather than a problem-solving contest, and it has a direct practical consequence. If your paper contains a model and a conclusion but no evidence that you interrogated either, the judge has nothing to evaluate except your confidence — and confidence is not evidence.
Sensitivity analysis and validation are the sections where a team supplies that missing evidence. They are also, in our editorial experience with China-based teams, the two sections most likely to be missing entirely, cut for space, or reduced to a single unlabelled table on page 19.
Three tests that actually fit inside a fortnight
Teams often imagine sensitivity analysis as something requiring statistical machinery they have not been taught. It does not. Three tests cover the ground, and all three are within reach of a Grade 10 team with a spreadsheet or twenty lines of Python.
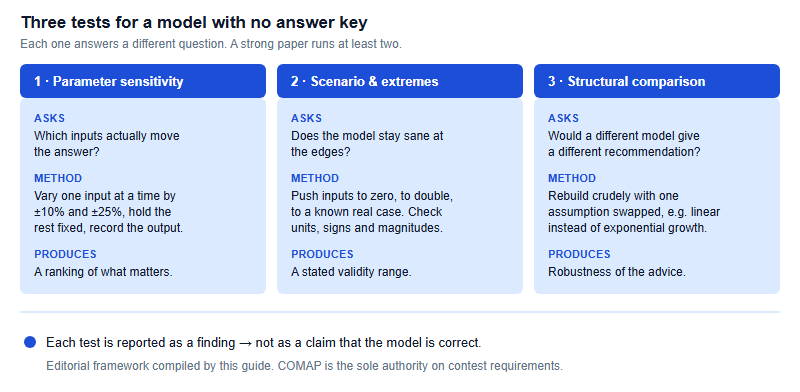
Test 1, parameter sensitivity, is the one most teams mean when they say “sensitivity analysis.” Take each numerical input your model depends on — a growth rate, a cost, a capacity, a probability — and move it while holding everything else still. Record how much the output moves. The point is not to produce a table; the point is to discover which two or three inputs your entire conclusion actually rests on, because those are the ones your assumptions section then has to justify hardest.
Test 2, scenario and extreme-case testing, is cheaper and catches more errors. Set an input to zero and ask whether the output is still physically meaningful. Double the population and check the answer scales the way it should. Feed in a case where you already know roughly what should happen. A model that returns a negative queue length, or predicts that adding staff increases waiting time, has a bug or a broken assumption, and it is far better for your team to find that on day nine than for a judge to find it in January.
Test 3, structural comparison, is the one that separates a thorough paper from a diligent one. Every model encodes structural choices — you chose linear over exponential, discrete over continuous, deterministic over stochastic. Rebuild a rough version with one of those choices flipped. If the recommendation survives, say so and you have a genuinely stronger paper. If it flips, you have found the real fault line in the problem, which is more interesting than a robust answer and should be written up as such.
What the analysis looks like on the page
Doing the test and reporting the test are different skills, and space is finite. COMAP states there is no required minimum length and that teams may use up to 25 total pages for all solution work and any additional material such as drawings, diagrams, calculations and tables — confirm the current limit on comap.org. Inside that envelope, sensitivity analysis earns roughly one to two pages, and it should contain three things.
| Element | What it contains | Common failure |
|---|---|---|
| A table of ranges | Each parameter, its baseline value, the range tested, and the resulting change in the output — stated in the same units throughout | Testing ±1% so nothing moves, then declaring the model “robust” |
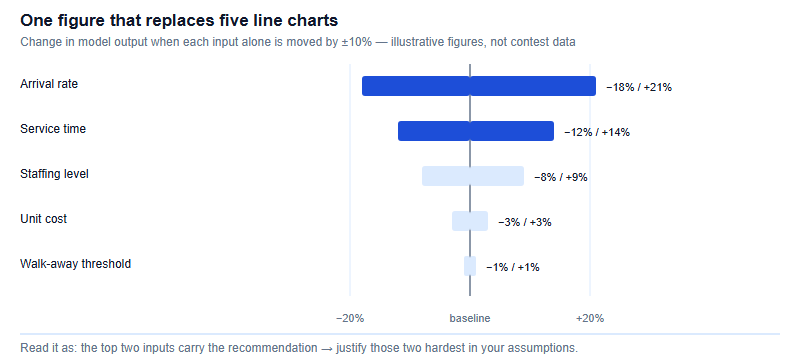
| One figure | A ranked comparison so a reader sees in two seconds which input dominates | Five near-identical line charts that each show one parameter, using a page and a half |
| A paragraph of interpretation | What the result means for the recommendation, and which assumption now needs the strongest justification | Numbers with no sentence attached — the reader is left to infer the conclusion |
| A stated validity range | The conditions under which you claim the model holds, e.g. “for daily volumes between 200 and 2,000” | An unbounded claim that quietly implies the model works everywhere |
The interpretation paragraph is the part teams skip and the part that carries the value. A table of percentages is data. A sentence that says “because the output moves 21% for a 10% change in arrival rate but under 3% for a 10% change in unit cost, our recommendation depends far more on demand forecasting accuracy than on pricing, and Section 3.2 therefore justifies the demand estimate in detail” is analysis — and analysis is a word COMAP itself uses when describing what its judges reward.
When the model fails its own test
Somewhere around day ten, a team runs the extreme case and the model does something absurd. The instinct is to hide it, or to quietly narrow the tested range until the absurdity falls outside. Both are mistakes, and the second is worse because it converts an honest limitation into a misleading claim.
There are three legitimate responses, and all three make a better paper than concealment:
- Fix it, and say what you fixed. If the failure came from a modelling error — a missing constraint, a sign, an unhandled boundary — correct it and note in the paper that the extreme-case test surfaced it. That sentence is evidence that your process works.
- Bound it. If the model genuinely only holds over a range, state the range explicitly and justify why the range covers the situation the problem actually asks about. A model that honestly declares its domain is more useful than one that pretends to have none.
- Report the instability as a finding. If a small change in one input flips the recommendation, that is real information about the problem, not a defect in your work. Write it up: which input, what threshold, what a decision-maker should therefore measure before acting.
What no team should do is run the tests, discover nothing, and write “the model is robust.” A robustness claim with no supporting range, no tested magnitudes and no named parameters reads as decoration. If your sensitivity section could be pasted into any other team’s paper without editing, it is not doing work.
How COMAP describes the levels — and where analysis sits
COMAP’s published results documents describe the recognition designations in language worth reading closely, because the same few words recur. Wording varies between editions, so treat the table below as indicative and confirm current definitions on comap.org.
| Designation | COMAP’s published description (abridged) | What recurs |
|---|---|---|
| Honorable Mention | “above average effort in addressing all problem requirements”, containing elements judged to show “sound and supported processes in modeling and problem solving, analysis, conclusions, and communication of results” | supported · analysis · communication |
| Meritorious | “excellent in many aspects of modeling and problem solving, analysis, conclusions, and communication”; addresses all requirements in a “clear, well-supported, well-organized, and well-presented manner” | all requirements · well-supported |
| Finalist | “teams whose solution reports are exemplary and therefore reached the final round of judging”; separately, COMAP’s HiMCM tips article says “the best contest papers present complete and logical analysis in an organized and clear manner above and beyond simply addressing the requirements” | complete and logical analysis |
| Outstanding | per COMAP’s 2025 announcement, the “best of the best”, showing work in “modeling and problem solving, analysis, and communication” at the highest level relative to the submissions | the same three dimensions |
Two things stand out. First, analysis is named in most of these descriptions, alongside modelling and communication — it is not an optional extra section. Second, the ladder is not built on cleverness. It runs from addressing the requirements through supporting your work to complete and logical reasoning. Sensitivity analysis is one of the few sections where a team can visibly move itself along that axis in an afternoon.
A note on scale, since teams ask. COMAP reported that the 2025 contest drew 1,199 teams from over 500 schools across 24 countries and regions, and named eight Outstanding HiMCM teams and three Outstanding MidMCM teams. By our own arithmetic that puts Outstanding at well under one per cent of the field — which is exactly why a team should aim at the qualities in the table rather than at a designation.
If you study awarded papers to see how experienced teams handle this, study them for structure and reasoning only. Reading how a paper motivates its parameter ranges is legitimate preparation. Copying a model, prose, figures, code or citations is plagiarism and ends a team’s contest. The distinction matters more here than anywhere else, because sensitivity sections look formulaic and are therefore unusually tempting to imitate line by line.
Building the habit before November
Sensitivity analysis is a habit, not a technique, and habits are built on small problems. Take any model your team has already made — a past problem, a physics estimate, even a spreadsheet forecasting your school canteen queue — and run the three tests on it in ninety minutes. Produce the table, the ranked figure and the interpretation paragraph. Do that twice before November and the section stops being the thing you write at 11pm on the final day.
The deeper reason to practise is that testing your own model changes how you build the next one. Teams who have watched a conclusion collapse under a 25% parameter shift start writing assumptions differently: more specific, more bounded, more honestly hedged. That is the whole skill the contest is trying to teach, and it is why defensibility rather than correctness is the standard a HiMCM paper is held to.
Frequently asked questions
Is sensitivity analysis a required section in a HiMCM paper?
COMAP describes submissions as technical reports covering approach, assumptions, analysis and conclusions. For required sections, confirm the current instructions on comap.org.
How much of the page allowance should sensitivity analysis take?
Our editorial guidance is one to two pages: a range table, one ranked figure, and a paragraph interpreting what it means for your recommendation.
What if changing one input flips our recommendation?
Report it. Name the input, state the threshold, and say what a decision-maker should measure first. An instability found and explained is a genuine finding.
Can we just write that our model is robust?
Not usefully. A robustness claim needs named parameters, tested ranges and stated magnitudes, otherwise a reader cannot tell whether anything was actually tested.
This is an independent guide operated by Hanlin Education for China-based international-school students. We are not affiliated with, endorsed by, or sponsored by COMAP, which is the sole official authority for HiMCM rules, dates, registration and judging. Confirm all current details on comap.org before acting on anything here. Errors reported to us are corrected within 7 working days.