
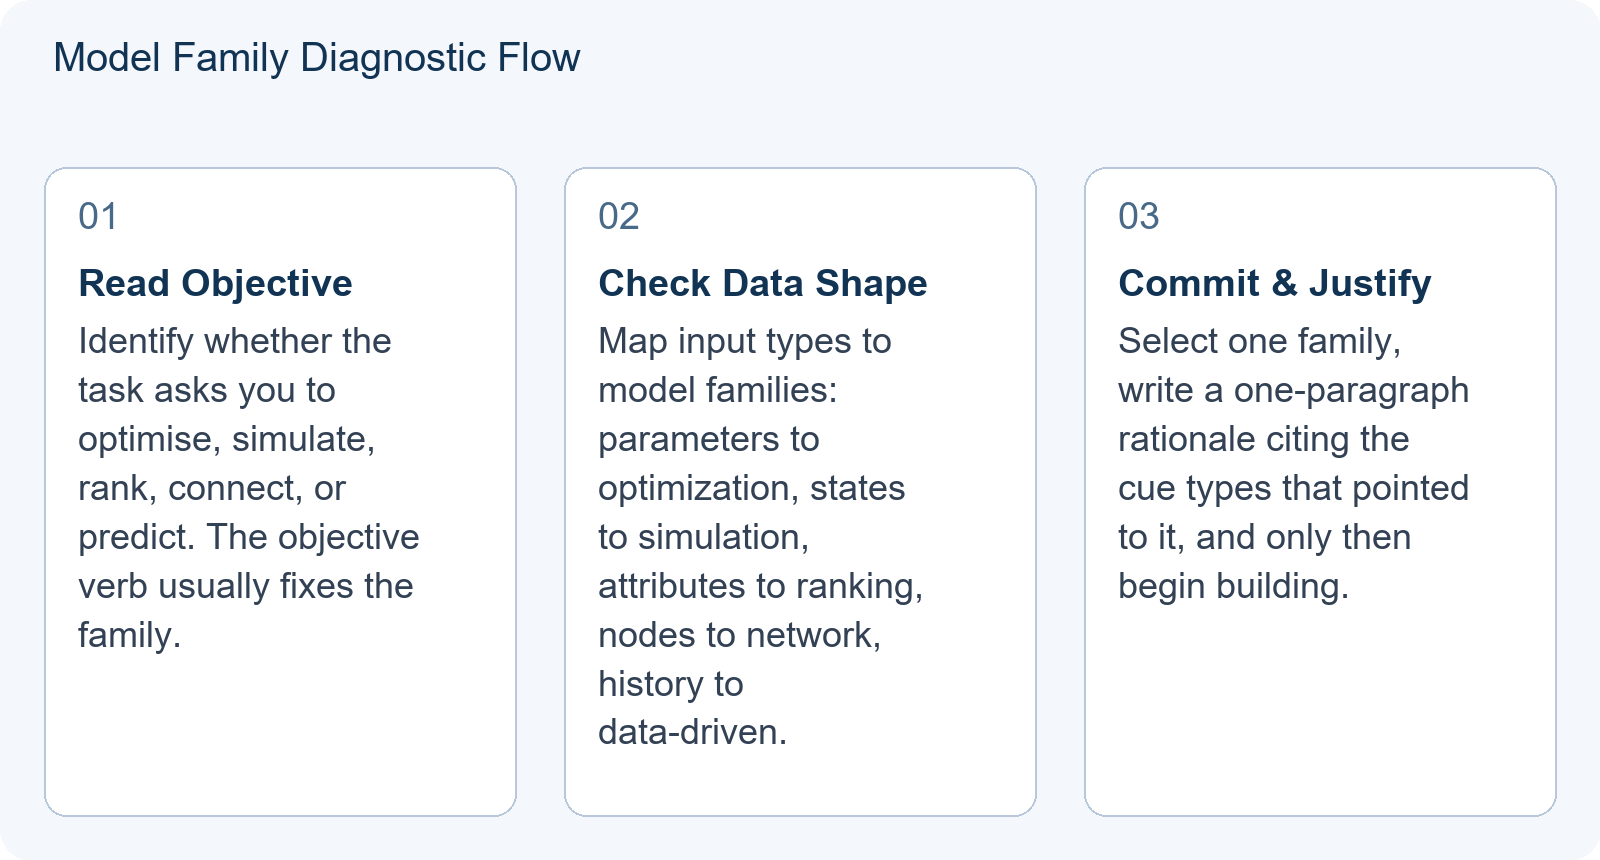
Many HiMCM teams arrive at the contest window with a favourite method. They have practised linear programming, or they know how to run a Monte Carlo simulation, or they have memorised an AHP-TOPSIS pipeline. When Problem A appears, they immediately try to fit it into that familiar structure. This is a common failure mode: template attachment overrides problem structure. The result is a paper that solves a different problem than the one COMAP asked.
The earlier question is not “how do I defend this specific method?” but “which broad model family does this problem actually require?” Choosing the wrong family early means every subsequent validation step is fighting against the grain of the problem. Model family is a structural commitment: it fixes what counts as evidence, what counts as a good answer, and what counts as a failed model. Get it wrong and the rest of the paper cannot recover. This article offers a fast diagnostic that reads problem structure, data shape, objective type, and time behaviour before a team commits to a family.
Five Common HiMCM Model Families
Preparation materials for HiMCM commonly group methods into a quick-reference taxonomy because the taxonomy is more useful than a method list. Based on that quick-reference, five model families cover the vast majority of HiMCM problems. Each family has a distinct structural requirement—the shape of the answer it produces, the inputs it needs, and the kind of uncertainty it tolerates.
- Optimization: Used when the objective is to find the best decision given constraints (for example, minimise cost, maximise throughput, or schedule a set of actions under a budget). The answer is a decision, not a description of a system. The presence of an explicit “should” or “best” wording in the prompt is the strongest single cue.
- Simulation: Used when the system involves stochastic processes, time evolution, or many interacting agents where analytical solutions are intractable. The answer is a distribution, trajectory, or set of emergent outcomes rather than a single number.
- Ranking/Scoring: Used when the task is to evaluate or order a finite set of alternatives against multiple criteria or preferences. The output is a ranking, a score, or a classification of named options.
- Network: Used when the problem is fundamentally about connectivity, flow, routing, or graph structure. Nodes and edges are the natural objects, and conservation or reachability properties are the natural constraints.
- Data-Driven: Used when the primary challenge is extracting patterns or predictions from a large dataset without a clear mechanistic model. The problem hands you observations and asks for inference, clustering, or forecast, not an explanation of mechanism.
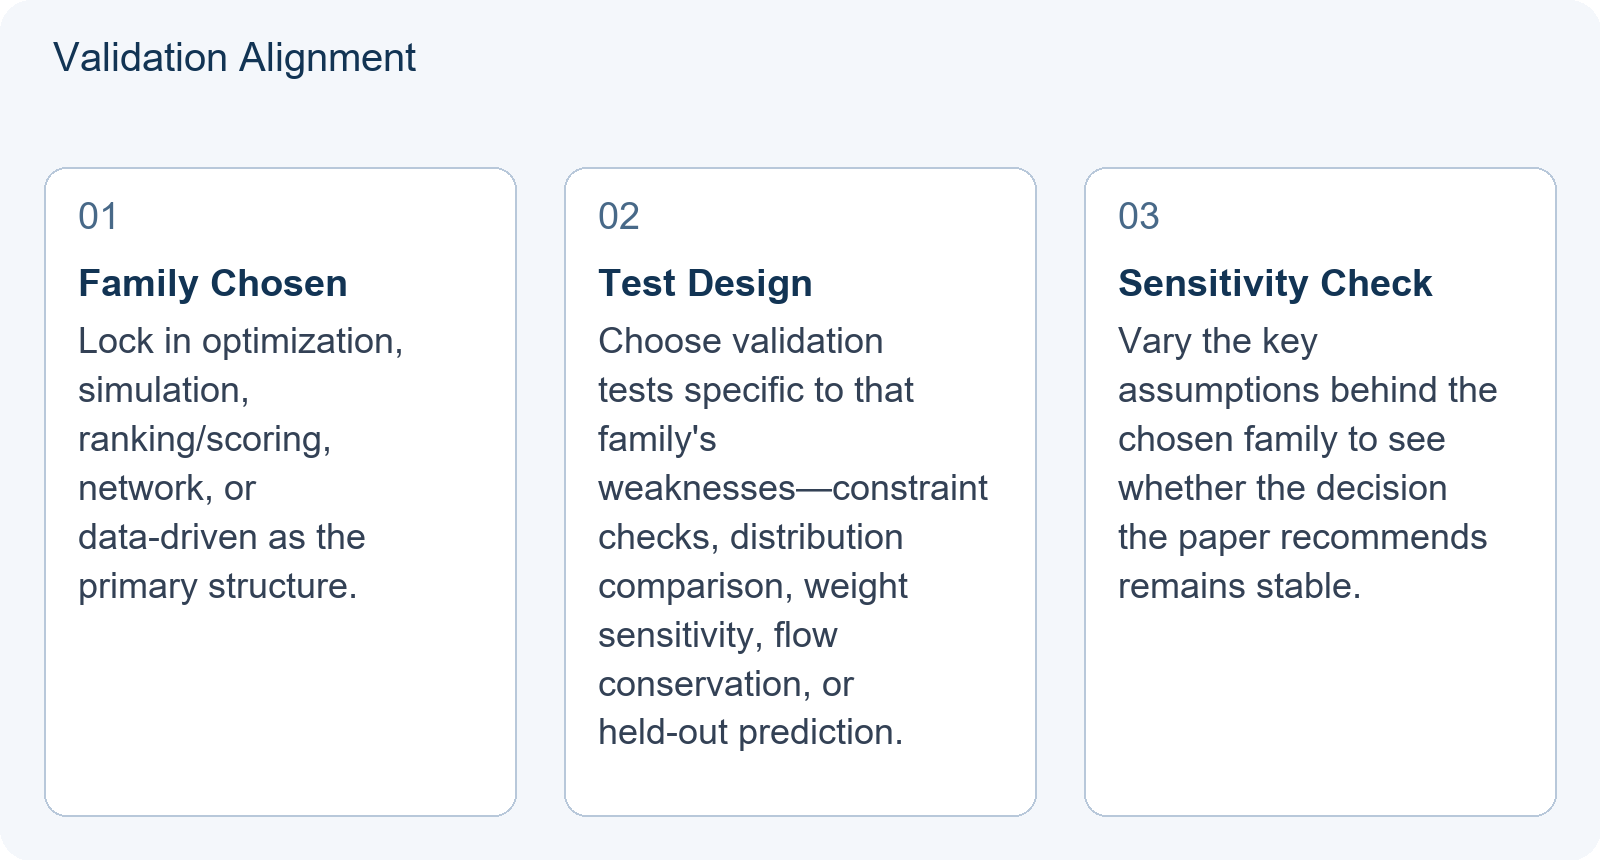
A modelling decision chain that places model-family choice and justification ahead of validation and sensitivity is what our study-pack methodology teaches, and for good reason. Validation design follows family choice. If you skip the family choice, your validation tests will be misaligned with what the model can actually be asked to prove. A chi-squared test means nothing to an optimization model; a constraint-satisfaction check means nothing to a neural network. Each family has its own natural test.
Decision Table: Mapping Cues to Families
Use this table as a pre-commitment diagnostic. Read the problem statement and identify which column matches best on at least three of the five cue types. Do not skim past a mismatch: if the objective column says optimization but the time-behaviour column says simulation, you are looking at a hybrid and should treat it as one (see the two-method trap below).
| Cue Type | Optimization | Simulation | Ranking/Scoring | Network | Data-Driven |
|---|---|---|---|---|---|
| Objective | Find best X given Y | Observe system behaviour over time | Evaluate or order options | Connect nodes or route flows | Predict outcome from features |
| Output | A decision vector or policy | Distributions, trajectories, emergent patterns | A score, rank list, or classification | A path, tree, or flow assignment | A forecast, cluster, or feature importance |
| Data Shape | Parameters, bounds, coefficients | Initial states, transition rules, probabilities | Criteria weights, alternative attributes | Adjacency matrices, edge capacities | Large historical records, labelled or unlabelled samples |
| Time Behaviour | Static or multi-stage decisions | Dynamic, iterative, stochastic | Snapshot evaluation | Static topology or dynamic routing | Temporal trends or cross-sectional patterns |
| Uncertainty | Sensitivity to parameters | Inherent randomness in agents or events | Subjective weight uncertainty | Edge reliability or demand variability | Noise in observations, missing values |
The cue types are ordered by how quickly they are usually readable from the problem statement. Objective is nearly always the fastest discriminator; data shape is the slowest and requires reading any provided tables carefully. When two families tie on objective and output, the time-behaviour column usually breaks the tie.
Worked Hypothetical Example: Congestion Problem
Teaching illustration only. Not an actual contest problem.
Imagine a HiMCM-style problem asks: “A city wants to reduce wait times at three major intersections during rush hour. You have traffic volume data for each approach lane, averaged over 30-minute windows across a typical weekday.”
A team trained in optimization might jump to minimising total delay by adjusting the signal timings on each approach. It is a recognisable shape—decision variables, an objective, constraints—and the team can start coding within an hour. But the cues do not actually support that leap:
- Time Behaviour: Rush hour is dynamic and stochastic; vehicles arrive in bursts, not at a fixed rate.
- Output Needed: A wait-time distribution, not just a single optimal green-time per lane.
- Data Shape: Volume in 30-minute windows is an arrival-rate estimate, not fixed demand; the variance between windows is part of the problem.
These three cues point to Simulation (for example, a discrete-event queue model) rather than closed-form optimization. An optimization model built on the 30-minute averages would implicitly assume deterministic arrivals at a fixed rate and would miss the queue formation that happens inside each window. The simulation written on the same data can produce a wait-time distribution, which is what the problem actually asks about.
If the same scenario instead asked: “Which of five proposed intersection redesigns scores highest on safety, left-turn efficiency, construction cost, and impact on pedestrian routes?”, the cues shift decisively to Ranking/Scoring. The output is an evaluation of named alternatives, the input is attribute data for each alternative, and time behaviour is a snapshot—the redesign is not modelled as evolving over a rush hour. There is no decision variable to optimise and no state to simulate; the correct family is the one that produces a defensible ordering.
Both paragraphs above describe the same city and the same physical setting. The trigger for switching family is a change in the objective and output, not in the physical setting. This is the whole point of the diagnostic: the family follows the question, not the scenery.
The Two-Method Trap
Teams sometimes combine families unnecessarily. For example, using a neural network to predict tomorrow’s traffic volume, then feeding that prediction into an optimization model for signal timing. This can be valid—but only if each method earns its place in the argument.
Ask a concrete question: does the prediction step change the decision boundary significantly? If the optimization’s chosen signal timings are unchanged whether predicted volume is 5% higher or 5% lower, the neural network is adding complexity without value. Simpler assumptions about volume may suffice, and the paper is shorter and cleaner without the second family.
Combining families should close a structural gap. Two patterns that justify combination: (1) the sub-problem’s uncertainty is large enough that a point estimate would mislead the downstream decision, or (2) the sub-problem’s output is the sole input structure that the downstream model needs and cannot construct itself. If neither pattern applies, the second family is decoration. For a systematic test of whether an extra model layer earns its place, see the discussion in our related coverage on HiMCM Baseline Models: Making a Complex Approach Earn Its Place, which is about the same evaluation applied to method depth rather than family breadth.
Thirty-Minute Team Diagnostic
Before opening any software, spend 30 minutes as a team answering these questions. Write the answers on a shared sheet; do not rely on recollection later in the window.
- What is the core question asking us to produce? A number, a list, a policy, a distribution, or a pattern?
- Is the system static, or does it evolve over time with respect to the question?
- Are there explicit constraints we must satisfy, or are we evaluating a given set of options?
- Does the problem involve many interacting agents with random behaviour?
- Is the primary challenge handling large amounts of noisy data, or is the challenge modelling a mechanism we already understand?
Map the answers to the decision table. If two families seem plausible, choose the one with fewer assumptions. Simplicity is defensible; complexity requires justification. A team that writes an optimization model where a simpler ranking would have sufficed is not penalised for the extra mathematics—it is penalised for the reasoning gap that the extra mathematics papers over.
How Family Choice Feeds Validation
Once you commit to a family, your validation strategy follows naturally. The validation is not interchangeable across families. For a fuller treatment of how to test predictions on information the model did not fit, our HiMCM Model Validation: Test Predictions on Information You Did Not Fit covers the general principle; the family-specific mapping below shows how it applies here.
- Optimization: Validate by checking constraint satisfaction on the returned solution, and compare against a known benchmark or a simple greedy heuristic. If a trivial heuristic beats the model on the same inputs, the model is not yet earning its formulation cost.
- Simulation: Validate by comparing simulated output distributions against any real-world data the problem provides, and by checking that conservation laws or invariants hold in the simulated trajectories.
- Ranking/Scoring: Validate by sensitivity analysis on the criteria weights, and by checking consistency of the ranking across at least two independent aggregation methods.
- Network: Validate by checking flow conservation at internal nodes, reachability across the graph, and edge capacity constraints.
- Data-Driven: Validate by holding out a portion of the data before fitting and reporting performance on that held-out portion, and by checking whether a much simpler baseline closes most of the gap.
If your validation feels forced—if you are inventing tests that do not naturally fit the model—the family choice is the likeliest culprit. Revisit the diagnostic before adding more tests.
Conclusion: Choose Before You Fall in Love
The biggest risk in HiMCM is not mathematical error. It is solving the wrong problem because you were attached to a method. The five families each produce a different kind of answer, and the problem statement almost always contains enough cues to distinguish them before any code is written. Use the decision table to let problem structure dictate the family. Justify the choice in one paragraph of the paper so a reader can follow the reasoning. Then build, validate, and refine within that family.
For teams checking whether their current mathematical background is sufficient to run a chosen family end-to-end, our What Maths Does HiMCM Actually Use? A 2026 Readiness Check for IB, A Level and AP Students covers the expected preparation across IB, A Level, and AP curricula. HiMCM Guide is independently operated by Hanlin International Education and has no affiliation, sponsorship, endorsement, or official relationship of any kind with COMAP.
Frequently Asked Questions
Can I switch model families mid-contest?
Yes, but only if you realise the initial family cannot answer the core question the problem asks. Document why the first approach failed on a structural cue—objective, output shape, or data shape—and justify the new choice the same way you justified the first. Avoid switching because implementation is hard; implementation difficulty is usually a signal that the family is right but the method depth is wrong.
Is combining two families always bad?
No. Combining is reasonable when one family addresses a sub-problem the other cannot—for example, a data-driven forecast feeding a decision model whose inputs would otherwise be a single point estimate. Each component must earn its place by closing a structural gap, not by demonstrating technical breadth. If the downstream decision is unchanged by the upstream forecast, the second family is decoration.
How do I know if my data supports a data-driven model?
Data-driven models need enough volume and quality that a simple baseline does not already explain most of the variation. If you have few data points or high noise, a mechanistic family—simulation or optimization built on stated assumptions—is usually more defensible than a black-box predictor, because the mechanistic model can be tested against its own assumptions rather than against a held-out sample you may not have.