Why “Information You Did Not Fit” Is the Core Principle
In HiMCM, your model is judged on how well it explains and predicts a real-world problem. But a model that memorises its training data can look excellent while failing completely on new cases. The discipline that prevents this is out-of-sample validation: you test predictions on information the model was not allowed to see during fitting.
This article shows exactly how to apply that principle in a HiMCM context. We work through a checked teaching illustration, expose a contrasting case where a superficially similar method collapses, and give you a diagnostic you can run on your own draft before submission.
The Mechanism: Holdout, Prediction, and Error
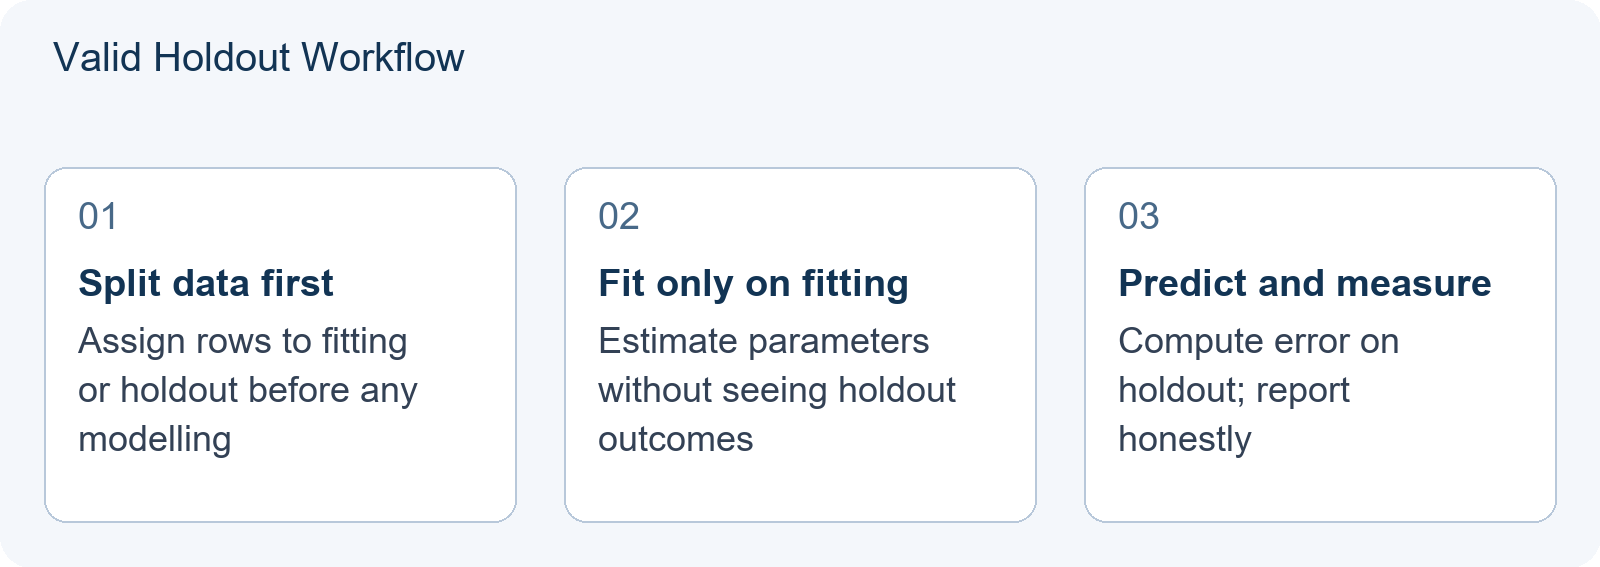
Out-of-sample validation has three steps:
- Split your data into a fitting set and a holdout set before you build any model.
- Fit your model only on the fitting set.
- Predict on the holdout set and measure error.
The holdout set is “information you did not fit.” If your model predicts well there, you have evidence that it captures a real pattern rather than noise. If it predicts poorly, your model is overfitted, misspecified, or both.
COMAP’s judging criteria reward exactly this kind of self-critical analysis. A paper that validates properly can defend its model as robust; one that skips validation risks having its conclusions dismissed as untested.
Important caveats about splitting: A random split assumes each row is independent. This fails for grouped data (multiple measurements from the same school) or time-dependent data (where later periods depend on earlier ones). In those cases, random splitting leaks information. Use group-aware or temporal splits instead.
Worked Teaching Illustration: Predicting Emergency Evacuation Times
Teaching illustration — all data below is synthetic for pedagogical purposes, not a validated dataset.
Suppose your HiMCM problem asks you to model evacuation times for a stadium. You have synthetic data from 50 drills, each with: crowd density (people/m²), number of exits, average walking speed (m/s), and observed evacuation time (minutes).
Step 1: Split Before Touching the Model
Randomly assign 40 drills to the fitting set, 10 to the holdout set. Record which rows are which. Do not look at holdout outcomes until after the model is chosen. Note: In a real contest with grouped or temporal structure, you would need a split that respects that structure.
Step 2: Fit on the Fitting Set Only
On the 40 fitting drills, you fit a linear model:
Time = β₀ + β₁·Density + β₂·Exits + β₃·Speed
Suppose ordinary least squares yields:
- β₀ = 12.4
- β₁ = 4.2
- β₂ = −1.8
- β₃ = −5.6
We check: negative coefficient on exits makes sense (more exits, faster evacuation). Negative on speed also makes sense (higher walking speed, lower time). The signs are internally consistent. R² on the fitting set is 0.87 — reasonably good, but we do not yet know if this transfers.
Step 3: Predict on the Holdout Set
Apply the fitted equation to each of the 10 holdout drills. Compare predicted to actual.
| Drill | Actual (min) | Predicted (min) | Residual |
|---|---|---|---|
| H01 | 18.2 | 17.9 | +0.3 |
| H02 | 24.5 | 26.1 | −1.6 |
| H03 | 15.7 | 16.4 | −0.7 |
| H04 | 31.0 | 29.8 | +1.2 |
| H05 | 22.3 | 23.7 | −1.4 |
| H06 | 19.8 | 18.5 | +1.3 |
| H07 | 27.6 | 28.4 | −0.8 |
| H08 | 14.9 | 15.2 | −0.3 |
| H09 | 33.4 | 32.1 | +1.3 |
| H10 | 21.1 | 20.5 | +0.6 |
Step 4: Compute Holdout Error
Mean Absolute Error (MAE) on holdout: (|0.3| + |−1.6| + |−0.7| + |+1.2| + |−1.4| + |+1.3| + |−0.8| + |−0.3| + |+1.3| + |+0.6|) / 10 = (0.3 + 1.6 + 0.7 + 1.2 + 1.4 + 1.3 + 0.8 + 0.3 + 1.3 + 0.6) / 10 = 9.5 / 10 = 0.95 minutes.
Root Mean Squared Error (RMSE): sqrt((0.3² + 1.6² + 0.7² + 1.2² + 1.4² + 1.3² + 0.8² + 0.3² + 1.3² + 0.6²) / 10) = sqrt((0.09 + 2.56 + 0.49 + 1.44 + 1.96 + 1.69 + 0.64 + 0.09 + 1.69 + 0.36) / 10) = sqrt(11.01 / 10) = sqrt(1.101) ≈ 1.05 minutes.
These numbers are your defensible evidence. You report: “Our linear model achieves MAE = 0.95 min and RMSE ≈ 1.05 min on 10 held-out drills, suggesting the relationship may generalise to unseen scenarios.”
Contrasting Case: Where Validation on Fitted Data Fails
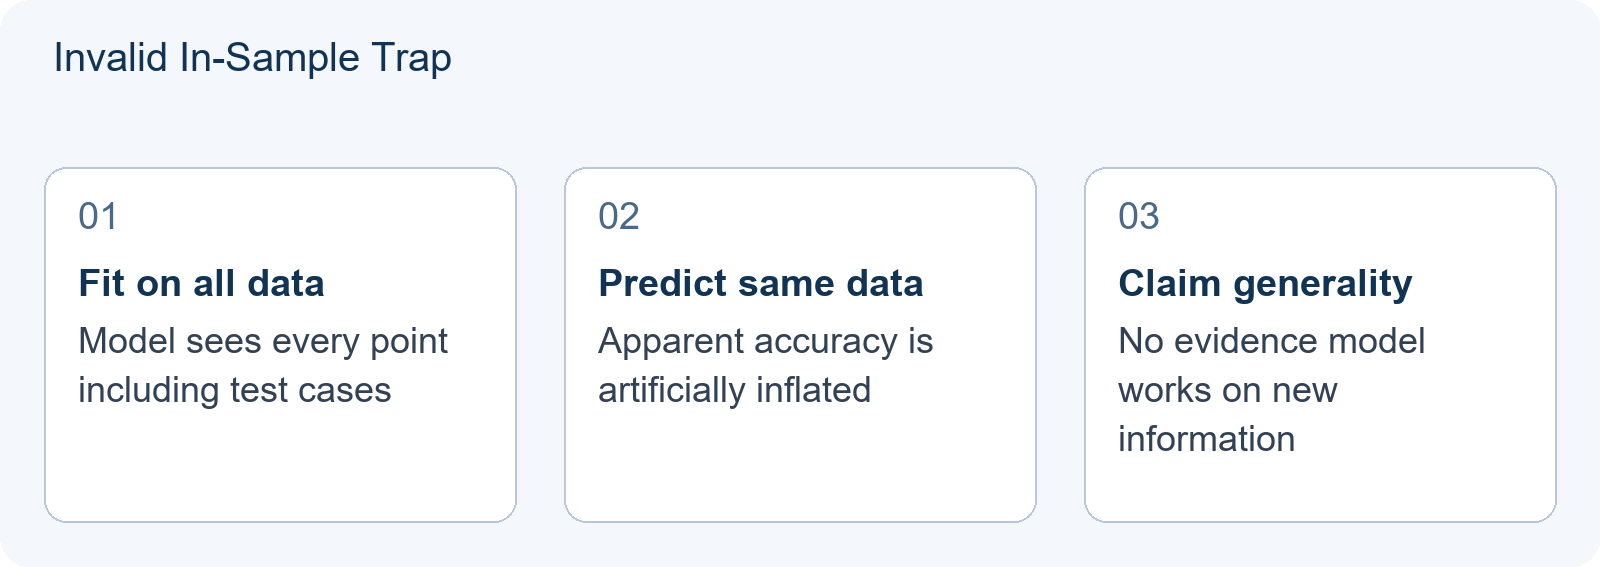
Now suppose a team skips the holdout. They fit the same model on all 50 drills, then report “validation” by predicting on those same 50. Their in-sample MAE is 0.82 minutes — apparently better.
But this is in-sample validation, and it is logically invalid as evidence of generalisation. The model has already seen every data point; it can exploit noise specific to those drills. When new stadium configurations arise, the team has no information about how it will perform.
The arithmetic check: in-sample MAE (0.82) < holdout MAE (0.95). This inequality is common but not guaranteed — OLS minimises MSE on the fitting data, and with small samples, random variation can produce in-sample error above holdout error. The gap (0.13 min here) is a rough indicator of overfitting, but a small gap alone does not prove genuine pattern capture. Teams that report only in-sample error are either unaware of this distinction or hoping judges will not notice — neither strategy succeeds at the award level.
Diagnostic: The Three-Question Holdout Audit
Before finalising your HiMCM paper, run this on every predictive model:
- Did I partition before fitting? If you selected or adjusted the model using the same data you now call “test” data, the answer is no — restart. The partition must be fixed before any model selection begins. If you use the holdout to adjust your model, that holdout becomes part of your validation process; you then need a fresh untouched test set or use nested cross-validation.
- Does my holdout error match my claimed accuracy? Report the actual number, not a rounded or best-case figure. Judges prefer honest uncertainty to inflated precision. If your holdout RMSE is 1.05 minutes, do not write “approximately 0.8 minutes” because that looks better.
- What would make this error unacceptable? Define a threshold before seeing results. If evacuation time errors above 2 minutes would cost lives, your MAE of 0.95 is promising but not sufficient — you need sensitivity analysis and perhaps a more conservative model with higher accuracy at the cost of some simplicity.
What the Diagnostic Means for Your Next Learning Task
If your holdout error is large relative to the problem scale, your next task is not to tweak parameters but to question structure. Common fixes:
- Add interaction terms: evacuation speed and crowd density may interact nonlinearly. At high density, walking speed drops non-proportionally.
- Check data quality: outliers in the fitting set distort coefficients that then mis-predict holdouts. A single drill with miscounted crowd could bias β₁ substantially.
- Try a different model family: the linear assumption may fail at extreme densities. A piecewise linear or logistic model might capture threshold effects near exit capacity.
Useful feedback at this stage comes from a teammate or coach asking: “What would have to be true about the world for this model to fail on a new stadium?” That question directs you toward robustness checks — varying exit widths, simulating blocked exits, testing weekend vs. weekday crowds — that strengthen your paper’s defensibility. Remember: coaching and preparation help before the contest window opens. During the 14-day HiMCM window, your team must work independently; external assistance violates COMAP’s rules.
Related Preparation and Context
For adjacent topics, see our guides on HiMCM Missing Data: Comparing Imputation Choices Without Hiding Uncertainty, HiMCM Baseline Models: Making a Complex Approach Earn Its Place, and No Answer Key: How to Test Your Own HiMCM Model With Sensitivity Analysis and Validation. These cover complementary aspects of model reliability that COMAP judges expect, from handling incomplete data through establishing baseline comparisons to comprehensive sensitivity frameworks.
COMAP’s 2026 AI Disclosure Rule
COMAP’s 2026 instructions require teams to disclose any use of large language models or other AI tools in an additional report beyond the 25-page solution. This report must specify which model was used and for what purpose, using inline citations and a references section. The AI Use Report has no page limit and does not count toward the 25-page envelope. See HiMCM AI Use Report: What COMAP Requires Beyond the 25-Page Limit and How to Format It for formatting guidance.
Interpreting the Gap: When Holdout Error Is Small but Meaningless
A small difference between in-sample and holdout error is often treated as proof of a robust model. This is a dangerous simplification. In HiMCM, judges look for structural validity, not just numerical accuracy. A model can have near-zero overfitting gap yet fail completely because it captures a spurious correlation or ignores physical constraints.
Consider a teaching illustration where your evacuation model predicts time based on crowd density alone. If all 50 drills were conducted at night with identical lighting, density might correlate perfectly with time due to an unmeasured variable (e.g., panic levels). Your holdout error could be tiny, but the model would collapse when applied to daytime scenarios. The validation confirms the pattern exists in the data; it does not confirm the pattern causes the outcome.
The “Why” Check: Causal Plausibility vs. Statistical Fit
To avoid this trap, add a fourth step to your diagnostic:
- Identify omitted variables: List every factor that affects evacuation time but was not included in your model (e.g., exit width, weather, emergency announcements).
- Test sensitivity to omissions: Manually adjust one omitted variable in your holdout predictions. If changing exit width by 10% alters predicted time by less than 1%, your model likely ignores a critical physical constraint, even if its statistical fit is good.
- Check coefficient magnitudes: Do the fitted coefficients make physical sense? If β₂ (exits) is −0.01 minutes per exit, adding ten exits saves only six seconds. This is statistically valid but practically absurd. Judges will reject models that produce physically implausible results, regardless of low RMSE.
Contrasting Case: High Gap, Valid Model
Conversely, a large holdout gap does not always mean overfitting. It may indicate data distribution shift. Suppose your fitting set contains mostly small crowds (density < 2 people/m²), but your holdout set includes large crowds (density > 4 people/m²). Linear models often fail at extremes because relationships become nonlinear (e.g., flow rates drop sharply above capacity thresholds).
In this case, do not discard the model. Instead, report the gap explicitly: “Our linear model generalises well within densities of 1–3 people/m² (MAE = 0.9 min) but degrades at higher densities (MAE = 4.2 min), suggesting a need for piecewise modelling.” This demonstrates self-awareness and scientific rigour—qualities COMAP rewards highly.
Actionable Takeaway
Use holdout error to assess predictive reliability, not model truth. Always pair numerical validation with qualitative checks: Does the model respect known physics? Are key assumptions stated? Would the model behave sensibly under extreme conditions? A paper that admits limitations and proposes targeted improvements scores higher than one that claims perfect accuracy without justification.
Frequently Asked Questions
Can I use cross-validation instead of a single holdout set in HiMCM?
Yes, k-fold cross-validation is valid and sometimes preferable with small datasets. The key rule remains: every test prediction must be on data not used to fit that particular model instance. Report your cross-validated error clearly, and explain why you chose that method given your data size. With only 50 drills, 5-fold cross-validation may give more stable error estimates than a single 10-point holdout, though it is not guaranteed — leave-one-out cross-validation can have high variance with small samples. The computational overhead is higher regardless of method.
What if my holdout set has only 5-10 points?
Small holdouts are common in HiMCM. Report the error but also its uncertainty — wide intervals are honest. Consider leave-one-out cross-validation to use data efficiently, though with high variance when sample size is small. The judges value transparent handling of limited data over pretending certainty. With 10 points, your MAE of 0.95 has substantial sampling variance; reporting a rough interval (e.g., based on the standard error of your absolute residuals) shows statistical maturity.
Does COMAP require a specific validation method?
COMAP does not mandate a specific validation technique. What matters is that you demonstrate critical self-assessment: show the reader you tested your model against information it did not see, reported the results honestly, and adjusted your claims accordingly. See COMAP’s official instructions for general judging criteria. The 2026 instructions explicitly note that teams must disclose AI tool use in an additional report beyond the 25-page solution, but validation methodology remains at the team’s discretion.